


When Markets Fall | Pullbacks and Drawdowns

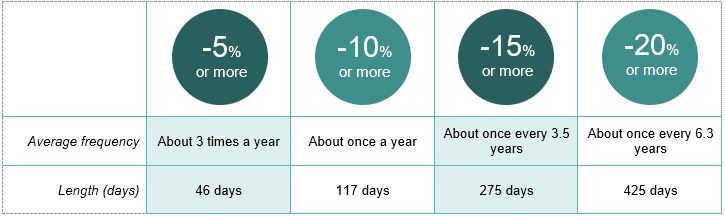
Market declines come in all shapes and sizes. The below chart reflects the average frequency of various size market pullbacks and drawdowns. Pullbacks, or declines of 5-10% have occurred frequently in the markets, averaging about 3 times a year. Corrections are generally defined as declines of 10%, but less than 20%, and have happened as often as once a year. Market declines of 20% or more occur less frequently, averaging once every 6 years. A drawdown of this size typically denotes a “bear market”.
Bear markets can last for a while, but that is not always the case. The bear market in early 2020 lasted for only 33 days. For long-term investors, research has shown it is generally not wise to try and time the markets in times of market volatility and uncertainty. Even in bear markets it is wise to “stay the course” so not to miss out on the market’s eventual recovery.
It is important to keep in mind that current market conditions rarely provide a clear direction as to the future performance of the markets. While past results don’t guarantee future returns, markets have always recovered from past market pullbacks and drawdowns. Market declines should remind plan participants to focus on their long-term investment strategy and goals. If those remain intact, then in many cases staying the course (doing nothing) is often the best course of action.
For more information on current market conditions, please call your Retirement Plan Advisor.
Chart Source: RIMES, Standard & Poor’s. Assumes 50% recovery of lost value. Length measures market high to market low.
This material contains an assessment of the market and economic environment at a specific point in time and is not intended to be a forecast of future events, or a guarantee of future results. Forward-looking statements are subject to certain risks and uncertainties. Actual results, performance, or achievements may differ materially from those expressed or implied. Information is based on data gathered from what we believe are reliable sources. The opinions expressed in this commentary are those of the author and may not necessarily reflect those held by Kestra Investment Services, LLC or Kestra Advisory Services, LLC. This is for general information only and is not intended to provide specific investment advice or recommendations for any individual. It is suggested that you consult your financial professional, attorney, or tax advisor with regard to your individual situation. Comments concerning the past performance are not intended to be forward looking and should not be viewed as an indication of future results.
ACR# 4767871 06/22